what3words: Now Everyone Can Say, “I.Am.Here”

1662165564_d29a0cafa9_z

Growing up on a farm, I didn’t have an address, just rural-route and post-office-box numbers. Our gravel roads weren’t named either, so to tell someone how to find us, we’d have to talk about driving a certain number of miles north, south, east, or west, crossing a bridge, or turning at a red barn.

Oh, how things have changed. Not only do my family members who live in the country now have house numbers and road names, we’ve also got that GPS thing. But there are still plenty of places in the world like the wild, wild midwest of my youth—places without registered addresses.

Take, for instance, Mongolia, a country more than twice the size of Texas, where many of its 3 million people live as nomads. What’s a post office to do? Well Mongol Post, the country’s postal service, recently turned to what3words for help. The London-based what3words has divided the globe into a grid of 57 trillion 3-meter by 3-meter squares, each with a unique 3-word label. So instead of needing a street address or directions or an unwieldy and hard-to-remember set of latitude/longitude coordinates, Mongol Post deliveries can go to places such as “cabdriver.salesclerk.scruff” or “graces.bigwig.pictures.”

According to what3words’ About page, 75% of the world’s population—4 billion people in 135 countries—don’t have adequate addressing systems. This causes difficulties not only in delivering mail but also in such things as reporting crimes, advertising a business, and delivering humanitarian aid.

what3words also solves problems in travel and tourism, and that holds true in even the most-developed countries. That’s because while a particular location may have a usable address, finding a place within that location can be difficult. For instance, you could use it to meet friends at a specific entrance at the airport. Or you could let someone know your place on a hiking trail. Or you could use it in a parking lot to find your car.

The system they developed by what3words currently has versions in 9 languages (English, French, Spanish, Portuguese, Swahili, Russian, German, Turkish, and Swedish), and the organization guarantees that the word combinations pinned to a particular location will never change.

Oh, and there’s another use for what3words that I haven’t heard anyone else mention: naming your garage band. Sure you can use the Band Name Maker, but how much cooler would it be to use three random words that correspond with the garage where your band was born?

(Giles, “Partner: Mongolian Post Adopts what3words as National Addressing System,” what3words, May 24, 2016)

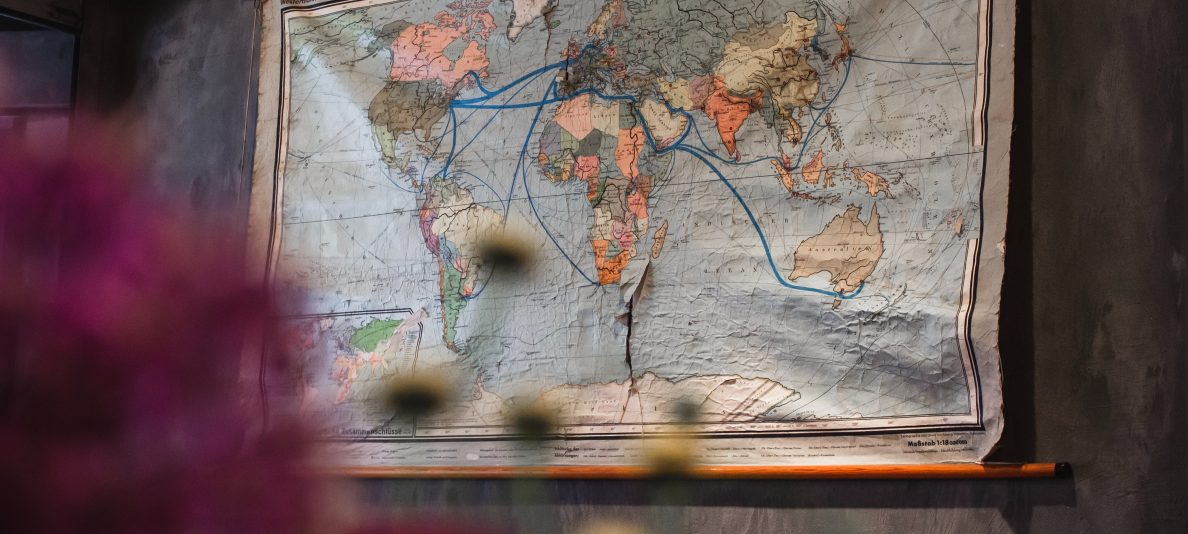
[photo: “In the middle of nowhere,” by Ernesto Graf, used under a Creative Commons license]

Global Statistics: You Probably Don’t Know What You Don’t Know, You Know?

7658298768_e4c2c2635e_zFinals. In just a few short weeks comes that time of the school year when students sit down to tests that have the sole purpose of showing how much they know. Or as some would put it, the purpose of the tests is to show how much they don’t know. Gapminder’s “Ignorance Survey” fits into this second way of thinking.

Gapminder is a foundation that promotes a better understanding of statistics to aid in global development. It’s cofounder, and most visible spokesperson, is Hans Rosling, a Swedish medical doctor, statistician, and professor of global health. (To see Rosling and his statistics very much in action, go to “5 Stat Sites That Eat Pie Charts for Lunch.”)

If you’re not worried about finding out what you don’t know, click over to The Guardian‘s “Population Quiz: How Well Do You Know the World?” It’s an interactive collection of 9 questions from Gapminder’s “Ignorance Project,” covering such topics as life expectancy, education, and income.

After you’re done, come back and watch Hans Rosling and his son, Ola, explain in a TED Talk how our intuition has been hijacked—to the point where most people, including educators and the media, score worse on Rosling’s tests than if they’d picked the answers at random. Or as the Roslings put it, they do worse than chimps grabbing at bananas. “Only preconceived ideas can make us perform worse than random,” says the elder Rosling, at the “Ignorance Project” page.

At the end of their talk, they give four “practical tricks” for overcoming those preconceived ideas. But before you jump ahead, if you haven’t done it already, you really should try the “Population Quiz.” If you don’t know what you don’t know, you won’t know what you need to know.

(The “Population Quiz” will calculate your score, and if you don’t get 100% right, click on “Show Answers” at the bottom of the results page.)

(Hans Rosling, “Population Quiz: How Well Do You Know the World?” The Guardian, November 7, 2013)

[photo: “Confused,” by CollegeDegrees360, used under a Creative Commons license]

It Can Rain on My Parade

6677854125_b6671e2b79_z

Is rain a good or bad thing? It depends, you’d probably say, on what you’re doing at the time.

But when we hear “The rain falls on the just and the unjust,” we usually interpret it as “Bad things happen to good and bad people.”

I don’t think that’s what Jesus meant when he said, in the Sermon on the Mount,

You have heard that it was said, “Love your neighbor and hate your enemy.” But I tell you, love your enemies and pray for those who persecute you, that you may be children of your Father in heaven. He causes his sun to rise on the evil and the good, and sends rain on the righteous and the unrighteous. (Matthew 5:43-45 NIV)

In context, Jesus is talking about how we should give something good (love) to bad people, in the same way God gives the sunshine and rain to them. There certainly are places in the Bible that talk about bad things happening to good people, but I don’t think this is one of them.

E. Randolph Richards and Brandon J. O’Brien, in Misreading Scripture with Western Eyes, point out that we often miss the meaning of Bible passages when we don’t see from the point of view of the authors and audiences of Bible times. (I’ve written about that here.) This seems to be one of those passages.

In our modern American culture, we often pray for nice, sunny days. We want good weather for an outdoor wedding, for a trip to the lake, or for a long drive. And by good weather, we usually mean the absence of rain—and warm, but not too warm, temperatures are great, too.

If all of our prayers were answered, we’d probably have the longest drought in history. Of course, then our attitude would change and we’d think of rain as a blessing. That’s the way farmers most often see it. Of course, an ill-timed rain can keep them out of the fields, and over saturation and flooding can ruin a harvest. But it’s the lack of rain that causes the most problems.

Last year, the UN reported that the majority of the world’s population, 54%, now live in urban areas. According to the World Health Organization, 55 years ago, the urban population accounted for just 34% of the total. Two thousand years ago, that percentage was much less.

In Jesus’ day, the people had a direct tie to the land and the goods that it produced. Think of all the agricultural metaphors Jesus used to get his message across. But today, living and working in air-conditioned buildings with drinkable water only a faucet handle away, much of my thinking about rain centers around my walk to and from the car.

I try to pray less about the weather than I used to. Rather, I want to pray that I will be able to make the best of my day regardless of whether it rains or not. I realize that God is not going to tailor every weather pattern to my scheduled activities, in part because my wishes for that day may be just the opposite of what others want or need. As C. S. Lewis puts it, my downhill could be someone else’s uphill:

Yet again, if the fixed nature of matter prevents it from being always, and in all its dispositions, equally agreeable even to a single soul, much less is it possible for the matter of the universe at any moment to be distributed so that it is equally convenient and pleasurable to each member of a society. If a man travelling in one direction is having a journey down hill, a man going in the opposite direction must be going up hill. If even a pebble lies where I want it to lie, it cannot, except by a coincidence, be where you want it to lie. And this is very far from being an evil: on the contrary, it furnishes occasion for all those acts of courtesy, respect, and unselfishness by which love and good humour and modesty express themselves.

Yes, I pray fervently when tornados touch down or typhoons threaten or droughts bring about famine. But I pray less for weather variations simply to enhance my day. Actually, let me restate that first part: I pray fervently when severe weather threatens me, but my sporadic prayers are less than fervent when it comes to famine or flooding half a world away.

We all need to pray less for our corners of the world and more for the huge swaths of people who face disastrous weather each day. We need to pray that those of us with much will help those with little who are at the mercy of the elements. We need to pray that our down-hill walk does not cause someone else a more difficult journey. We need to pray less for our will and more for God’s will to be done, “on earth as it is in heaven.”

(“World’s Population Increasingly Urban with More than Half Living in Urban Areas,” United Nations, July 10, 2014; “Global Health Observatory (GHO) Data: Urban Population Growth,” World Health Organization; C. S. Lewis, The Problem of Pain, Centenary Press, 1940)

[photo: “Face à Face,” by D. Julien, used under a Creative Commons license]

What Would You Take to Your New Life in a Refugee Camp?

15484946326_0977d6da8b_z

When we lived overseas, we were encouraged to make lists of items we would need to grab in case of an evacuation. First there was the list for what to collect if we had only fifteen minutes to leave. Then there were lists for an evacuation in an hour, in 24 hours, and so on.

While a swift departure from our apartment in Taipei was a possibility, it didn’t loom over our heads as it does for many in other countries . . . so we never made a formal list. Rather, we had a cluster of absolutely-most-important-things kept in the same room: my laptop, our passports, extra credit cards, a printout of important contact information, a first-aid kit.

We never tackled listing the irreplaceable items, those with sentimental value. Like writing a will, it was hard to think about and too easy to put off.

If you had to leave your home in a hurry, what would you take? What if you had to escape your country, as well? And what if you knew it would probably be nearly 20 years before you were able to create a new home?

Melissa Fleming, chief spokesperson for the UN’s High Commissioner for Refugees, knows a lot about people who flee their homes and about what they lose and what they take with them. She knows a lot because she meets refugees and talks with them.

In her TED Talk, “Let’s Help Refugees Thrive, Not Just Survive,” she tells her motivation for what she does:

So I started working with refugees because I wanted to make a difference, and making a difference starts with telling their stories. So when I meet refugees, I always ask them questions. Who bombed your house? Who killed your son? Did the rest of your family make it out alive? How are you coping in your life in exile? But there’s one question that always seems to me to be most revealing, and that is: What did you take? What was that most important thing that you had to take with you when the bombs were exploding in your town, and the armed gangs were approaching your house?

She then shares the story of Hany, a young Syrian refugee who knew exactly what he would take when his family was forced to flee to Lebanon. “I took my high school diploma,” he said, “because my life depended on it.” He had risked his life in war-torn Syria to earn it, and he saw his education as his hope for the future.

Fleming goes on to tell more stories of refugees and to recount some sobering statistics, including these (I’ve added some additional numbers from “UNHCR: Facts and Figures about Refugees“):

  • The approximately 50 million forcibly displaced people at the end of 2013 is the highest number since World War II.
  • Each day last year, an average of 32,000 more people were forced from their homes.
  • 33 million of the displaced people remain in their own country. 16.7 million flee to other countries, making them refugees.
  • 86% of the world’s refugees are living in the developing world.
  • On average, a refugee will be displaced for 17 years.
  • The war in Syria has produced 6.5 million displaced people, about half its population. More than 3 million of them have entered neighboring countries.
  • Lebanon, a country of 4 million, is home to 1 million Syrian refugees.
  • Half of the Syrian refugees are children, and only 20% of those in Lebanon are in school.

Below is Fleming’s full TED Talk, followed by a video message from Hany, produced by the UNCHR.

The last video is “Lebanon: Through the Eyes of a Refugee,” featuring Hany’s photographs from his participation in the UNHCR workshop Do You See What I See? The two-week class on photography and writing was led by photojournalist Brendan Bannon.

[photo: “TG14_100814_DD5A2115_1920,” by James Duncan Davidson/TED, used under a Creative Commons license]

Two Ladies Step into the Slums of India . . . and Find Stories to Tell

5204718392_38cc34d558_z

Here’s my entry for the “first-world problems” meme: I accidentally left my copy of Katherine Boo’s Behind the Beautiful Forevers outside overnight. The next morning the pages were swollen from getting wet and I had to throw the dust jacket away.

Woe is me.

If you’ve read Behind the Beautiful Forevers, you’d recognize the irony.

Katherine Boo

Boo’s National Book Award-winning work, published in 2012, is the true story of the people of Annawadi, a slum in Mumbai, India, where ruined dust jackets are the least of their worries. Most of the characters barely scratch out their livings, many by sorting through trash and selling what they can. All are struggling against the surroundings they’ve inherited. There’s Abdul, a teenage garbage picker who supports his family. There’s Asha, who aspires to be a slumlord, and her daughter, Manju, who hopes to become Annawadi’s first female to graduate from college. There’s Abdul’s neighbor, Fatima, a one-legged woman who sets herself on fire, blaming Abdul and his family for her pain. Abdul, his father, and sister are arrested.

Sometimes trying to scratch out a living isn’t enough. Fatima dies from her injuries. Kalu, a young scrap-metal thief is murdered. And Meena, the first girl born in the slum, commits suicide by drinking rat poison.

Boo, winner of the Pulitzer Prize for her work in the Washington Post, was introduced to India by her Indian husband. As she writes in her “Author’s Note,” “I fell in love with an Indian man and gained a country. He urged me not to take it at face value.”

That she did not do. Instead, she moved to India and chose to dive into the gritty life of Anawadi, asking questions of what and why and how and what now . . . and listening to the many answers.

Before her move, she wondered if she could handle life in India, particularly spending time in the slums. During one night alone in Washington, D.C., she made up her mind:

Tripping over an unabridged dictionary, I found myself on the floor with a punctured lung and three broken ribs in a spreading pool of Diet Dr Pepper, unable to slither to a phone. In the hours that passed, I arrived at a certain clarity. Having proved myself ill-suited to safe cohabitation with an unabridged dictionary, I had little to lose by pursuing my interests in another quarter—a place beyond my so-called expertise, where the risk of failure would be great but the interactions somewhat more meaningful.

Listen to how she begins the story of what she found in Annawadi:

Lana Šlezić

Lana Šlezić is an award-winning freelance photographer who was born in Canada to Croatian parents. For two years she lived in Afghanistan, documenting with her camera the abuse of women there. The result is the book, Forsaken: Afghan Women.

But, she writes at lanaslezic.com, living in Afghanistan “was peanuts compared to raising kids.”

She says the birth of her first child brought an “emotional upheaval” that was “extraordinary.” When her son was just six weeks old, mom, dad, and baby boy moved to New Delhi. Then, less than two years later, their daughter arrived.

[E]very time I left our home in Delhi to drive across the city—my own children singing or crying or screaming in the back seat—without fail, I would see street kids while waiting at a traffic light. They were everywhere on every street corner and in every neighbourhood. At car windows they knocked relentlessly and if not asking directly for money then offering something in exchange—a dance, balloons, matches, plastic flowers, inflated airplanes, anything for a few rupees. It nagged at me but I had not the emotional nor physical energy to do anything but sigh and lean back into my seat. An inexplicable feeling of impossibility sat like vinegar in my stomach and started to turn me inside out so that my heart actually became visible. Friends told me I was grumpy.

So in December 2011 when I was wandering around Old Delhi—eyes wide open, conflicted heart in hand, mother of two with all the love that brings and a little less exhausted—I walked through a gate and onto a dirt field. It was a park, though not like any park I had known as a child. . . .

Šlezić was captured by what she experienced . . . children playing in the dirt, children showing her their homes amid the squalor, children talking about life and death. She returned again and again, listening to their stories, playing with them, and taking photos, lots of photos. Out of this she produced “A Walk in the Park,” a collection of striking documentary-style photographs as well as portraits of the children. You can see a gallery of her photos online, and you can view a set of nine portraits as well, each accompanied by a short story told in the child’s own words.

You can also watch the two videos below, which serve as sort of “trailers” for her project. As you can see, because of privacy settings, you’ll have to click the image and then click again to start them on Vimeo. What a bummer. That’s two clicks when one really should be enough.

Woe is me.

(Katherine Boo, Behind the Beautiful Forevers, Random House, 2012; Lana Slezic, “A Walk in the Park: Artist’s Statement,” lanaslezic.com)
[photo: “Pipe Play 2,” by Meena Kadri, used under a Creative Commons license]

Eyes: LensCrafters Commercial Gives Us a Closer Look

It didn’t cause quite the stir that Coke’s “America the Beautiful” in eight languages did, but LensCrafter’s new-this-week “Anthem” commercial also represents the mosaic of humanity. Instead of using voices, the eye-care company (as you might expect) uses eyes.

All people should have somebody who will, at some time or another, look deeply into their eyes.

While we’re on the subject of eyes . . .

Award-winning photojournalist Steve McCurry posts photos, grouped by theme, at his blog. For a collection of amazing photographs of eyes, interspersed with quotations and comments, go to his post from last July, “Eloquence of the Eye.”

You probably didn’t know . . .

  • The human eye is less than one inch in diameter and weighs only around 1/4 ounce.
  • Each blink closes the eye for 0.3 seconds. That totals about 30 minutes a day.
  • An eye has over 100 million photoreceptors (rods and cones).
  • 285 million people in the world are visually impaired, meaning they are blind or have moderate or severe impairment.
  • Blind people in the world number 39 million. 82% of them are over the age of 50.
  • The visually impaired in developing countries account for about 90% of the world’s total.
  • Preventions and cures are possible for 80% of visual impairment in the world.

(“NEI Calendar,” National Eye Institute; “Visual Impairment and Blindness, Fact Sheet No. 282,” World Health Organization, October 2013)

5 Stat Sites That Eat Pie Charts for Lunch

4434547381_582248cecb_nOne thing I don’t like about statistics is the way they usually look—a list or row or jumble of numbers that just sit on the page in black and white. Of course, there are line graphs and bar graphs and pie charts, but those can only punch the data up so much.

What I need are statistics presented in ways that grab my attention and that help me understand complicated ideas. What I need are number crunchers and artists working together to get a point across. What I need are people like Amanda Cox, a statistician and graphics editor for the New York Times, who told Scott Berinato of the Harvard Business Review,

There’s a strand of the data viz world that argues that everything could be a bar chart. That’s possibly true but also possibly a world without joy.

What I need—and what I found—are the following five sites that take global statistics and get them to stand up and jump off the page. Some combine the data in interesting ways. Some use eye-catching graphics. Some use video to show movement across time. And some let the numbers grow before your eyes.

Here they are. They’re in no particular order, except I’m starting with FlowingData because that’s where I found the above quotation from Amanda Cox.

1 – FlowingData
Nathan Yao’s blog helps us understand data by visualizing data. It’s not all about global statistics, but scrolling through the posts—and getting sidetracked a time or two—is well worth the effort. As an example of the range you’ll find, there’s “A Visual Exploration of Refugee Migrations,” “Average Man Graphic Renderings,”and a mockup of how big a single iPhone screen would be if all the iPhone screens in the world were put together. And Yao’s also created the “World Progress Report,” an infographic with data culled from UNdata’s 60 million records.

2 – Gapminder
Swedish global health expert, Hans Rosling, has an infectious enthusiasm for statistics. You can see it in the site for his Gapminder Foundation, in the Trendalyzer software the foundation developed “to unveil the beauty of statistical time series by converting boring numbers into enjoyable, animated and interactive graphics,” and in Gapminder World, which shows the software in action in over 20 amazing graphs. You can see it, too, in Rosling himself, with this cool demonstration of how he brings statistics to life, “200 Countries, 200 Years, 4 Minutes”:

Rosling, like Cox, is a proponent of the “joy” that can be found in statistics. For proof, watch his entire hour-long documentary on line. The video above is only a short clip from it. It’s entitled, appropriately, “The Joy of Stats.”

3 – NationMaster
Not just a great go-to site for world statistics, it slices, dices, crunches, and expands data from around the globe. It gives you the ability to create maps and graphs that compare countries in a number of categories, such as education, crime, and health, but it doesn’t stop there. You can also hit the “correlate” link to see the relationships between different statistics and how they might affect each other. Bet you didn’t know that the number of judges and magistrates in Russia is nearly twice the number in the United States. The US, on the other hand, has eight times the amount of crime.

And for a new way to see the world, take a look at NationMaster’s graphs that cluster countries based on their similarities in a number of categories.

4 – Worldometers
With Worldometers, you can watch the numbers grow in real time. Its site has 61 counters on such global topics as population, televisions sold, emails sent, amount of oil remaining, and deaths by cancer. For more  info on cyber statistics, go to its Internet Live Stats page. There you can also see a graphical representation of the huge numbers, but no picture is bigger than the one at 7billionworld, where all 7 billion of the world’s population is shown one by one on a single scrollable page.

5 – Poodwaddle World Clock
The World Clock applet at Poodwaddle ups the ante with over 170 real-time counters in nine categories, including one titled “Smile: It ain’t all bad news.” There are so many counters, accessible for the year, month, day, and “now.” And if you’d like your data even more available, you can embed the free World Clock widget on your own website or blog. That way you can keep track of how many Coca-Cola products have been consumed this year. (Hint: It’s at a rate of 1.9 billion servings a day.)

(Scott Berinato, “The Power of Visualization’s ‘Aha!’ Moments,” the Harvard Business Review, March 19, 2013)

[photo: “Pie Chart,” by John Cooper, used under a Creative Commons license]

Slavery Didn’t End with the Civil War

7946241182_2eddb17379_mThere are more slaves in the world today than at any other time in history. In fact, estimated at 20-30 million, the current number of people enslaved in forced labor is well more than the 13.5 million people taken from Africa during the 350 years of the transatlantic slave trade.

The ballooning numbers of human trafficking is the subject of J. J. Gould’s article, “Slavery’s Global Comeback,” published in The Atlantic this past December. Gould not only covers the statistics but looks at the definitions and perceptions concerning slavery as well as abolitionist movements throughout history.

While, on the one hand, the numbers are worse than they’ve ever been, Gould also sees a reason for muted optimism: Because of the increase in the world’s overall population, the percentage of people currently enslaved is at an all-time low, and the $30-45 million generated by slavery annually is the smallest-ever portion of the global economy. This, along with a growing global intolerance for human trafficking, makes Gould wonder if the current situation is nearing a tipping point for a new abolition movement.

The Faces of Slavery
Slavery takes many forms around the globe, and photographer Lisa Kristine has spent the past two years documenting them with her camera. Kristine first became aware of the scope of human trafficking when, at an exhibit, she met a representative of Free the Slaves. Since then, her subjects have included slaves in the brick kilns of Nepal and India who carry bricks on their heads for 16 to 17 hours every day; children hauling sheets of slate from quarries in the Himalayas; sex slaves in Kathmandu; families in Uttar Pradesh enslaved coloring silk in vats of toxic dye; an estimated 4,000 children forced into fishing on Lake Volta in Ghana; and people forced to pan for gold in water poisoned with mercury, as well as miners and those who crush the stones from the mines, looking for gold, also in Ghana.

You can see her photos and hear her stories in the following TEDtalk. She ends her presentation by showing photographs she took of slaves holding candles she had given them, symbolically “shining a light” on their tragic circumstances. She says,

They knew their image would be seen by you out in the world. I wanted them to know that we will be bearing witness to them. And that we will do whatever we can to help make a difference in their lives. I truly believe, if we can see one another as fellow human beings, then it becomes very difficult to tolerate atrocities like slavery.

Not Just “Over There”
For those of us in the West, we need to realize that forced labor is not a problem limited only to the rest of the world. As present-day abolitionists are quick to point out, while slavery is illegal all over the world, it is also present all over the world. The International Labour Organization estimates that there are 1.5 million people in forced labor in “Developed Economies” (including the United States) and the European Union.

The movie, I Am Slave, gives a glimpse of the kind of slavery that is hidden in plain sight in the West. Inspired by the real-life story of Mende Nazer, it tells of a girl, Malia, stolen from her home in Sudan and forced to work for a family in London. The deeply moving film is advertised as a thriller, but it is less thrilling than it is frightening—frightening for “Malia Al-Noor, daughter of Bah Al-Noor, champion wrestler” . . . in her tribe, a princess . . . in London, a slave—and frightening for us all, as well.

Produced by Altered Image FilmsI Am Slave aired on Britain’s Channel 4 in 2010. It is available online in the UK at 4oD and can be rented for streaming at Netflix (viewer discretion, for “violence and some strong language”).

(J. J. Gould, “Slavery’s Global ComebackThe Atlantic, December 19, 2012; “ILO Global Estimate of Forced Labour,” International Labour Organization, June 1, 20102)

[photo: “Yr hudol eiliad olaf—Ynys-las,” by Rhisiart Hincks, used under a Creative Commons license]